Session 7: Computing

Our first foray into computing last week resulted in a really creative crop of games and ideas for lessons. We know this was new to many of you, so well done!  We are continuing with the theme of computing this week and thinking about ways for children to revisit computational thinking from different angles.

You may decide to consolidate your experiences with Scratch and come up with some concrete plans for using it in the classroom. If you’re feeling comfortable with Scratch you could compare it with Kodu, another free download, which is also based on creating games using visual programming. The Kodu software
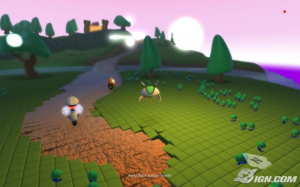
comes with some built-in tutorials or this apple collecting game is a good starting place. You’ll find a large selection of video tutorials on the Digital Schoolhouse site.  The idea of using a Kinect controller with Kodu is sure to appeal.

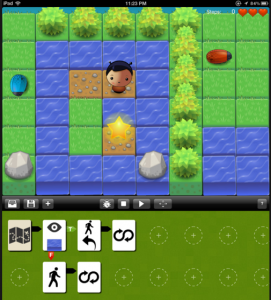
iPad apps also offer a way to explore computing in a game-like environment. Have a look at Daisy the Dinosaur, CargoBot and Cato’s Hike for applying programming logic. Create sequences of instructions for screen robots using Bee-Bot, A.L.E.X  or Move the Turtle. Or you can introduce the idea of modelling and simulations through ‘touch physics’ apps which allow children to tinker with joints, materials and motors and make models which respond to forces.  Try Tinkerbox, Monster Physics, Phyzios Studio, Gravity HD or Creatorverse (but bear in mind that the lite version is just a viewer). Another app, Sketchnation, offers a starting place for making your own games.
An entirely different avenue into computational thinking is through Computer Science unplugged, where children explore concepts away from the computer. Examples of this approach are the PE activity ‘how to train your robot‘ and the ‘how to program your teacher‘ lesson from Phil Bagge. Find more videos to support unplugged learning here.

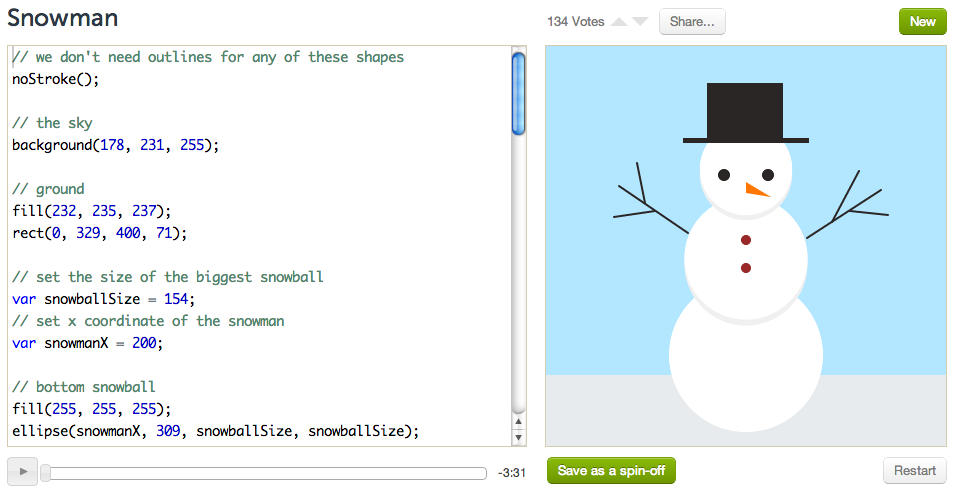
If you’re feeling ambitious, you could move on to manipulating written code.  The Khan Academy Computer Science site supports beginners by allowing them to make changes to code and see the effects on a canvas.  You can make your own version of animations, generative art effects, drawings fractals and games. An alternative is to follow step by step instructions to write the code for a drawing in this draw a puppy activity from Hopscotch Kids.

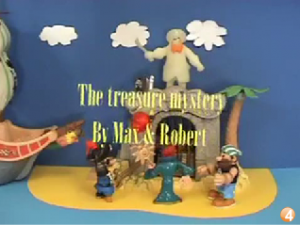
If you are working with KS1 the 2Simple software has much to offer. Have a look at the range of games and activities children can create with 2DIY (or 2DIY3D on Purple Mash) and how this can be extended to manipulate the script using these 2DIY coding cards.

There’s plenty more to explore in my Pinterest collection. See if you can come up with one resource, strategy or lesson idea to share.

Session 6: Games Based Learning and Computing

The new draft Programmes of Study published on 7/2/13 change the subject name from ICT to Computing and place a strong emphasis on Computer Science.

Over the next two weeks we’ll explore how children can use programming software to make their own games and how games can be used in the classroom to help meet learning goals, either as a starting point to inspire work across the curriculum (e.g. Kinectimals) or by learning within a game (e.g. SumDog). The theme of using games in the classroom is known as Games Based Learning (GBL).

Have look at some of these examples. Tim Rylands is well known for using Myst as a stimulus for creative writing. At one of our BLT events Ewan McIntosh shared writing inspired by Machinarium  (here’s a demo). The free app Epic Citadel based on the fantasy setting of Infinity Blade is another good writing stimulus. Lynette Barr’s blog describes how she creates graphic organisers for  Scribblenauts, which recognises 10,000 different words, to encourage her pupils to use adjectives and nouns creatively. Dawn Hallybone is renowned for her use of GBL, and her blog describes the use of Mario Kart as a jumping off point: for designing cards, writing adverts, planning a launch party, exploring air resistance and friction, making vehicles, and timing races. Wii Sports has inspired work on collecting data and calculating averages in Dawn’s classroom.

Scribblenauts

Whichever approach you take, there is no doubt that the mediation of the teacher is crucial to making learning through games happen. You’ll need to take an active role in facilitating the game, mapping it to curricular aims, organising the classroom, and transferring the learning beyond the context of the game.

One of our key themes is children as creators of content, not just consumers, and we’ll explore visual programming software that helps children create their own games. We’ll begin by looking at Scratch, a free visual programming language developed by Mitch Resnick and the Lifelong Learning Group at the MIT Media Lab. Although it has a range of uses, we’ll use Scratch as a platform for games design. In this context, it makes an engaging way to introduce programming skills and collaborative problem-solving, as well as offering a creative opportunity for children to demonstrate their understanding of a topic by turning it into interactive content.

Within Scratch you choose backgrounds, sprites, music and sounds, and clip them together like a jigsaw in the scripting area to make sequences of instructions defining their behaviours. Sequences are broken down into conditions and actions such as ‘if..then..else’ or ‘while..do’. This introduces programming logic and problem analysis without the need to write complex code, allowing young learners to be creative and successful straight away:

Here are some example games which Year 5 and 6 children might work towards programming with support. Click on the green flag to start and the red dot to stop:

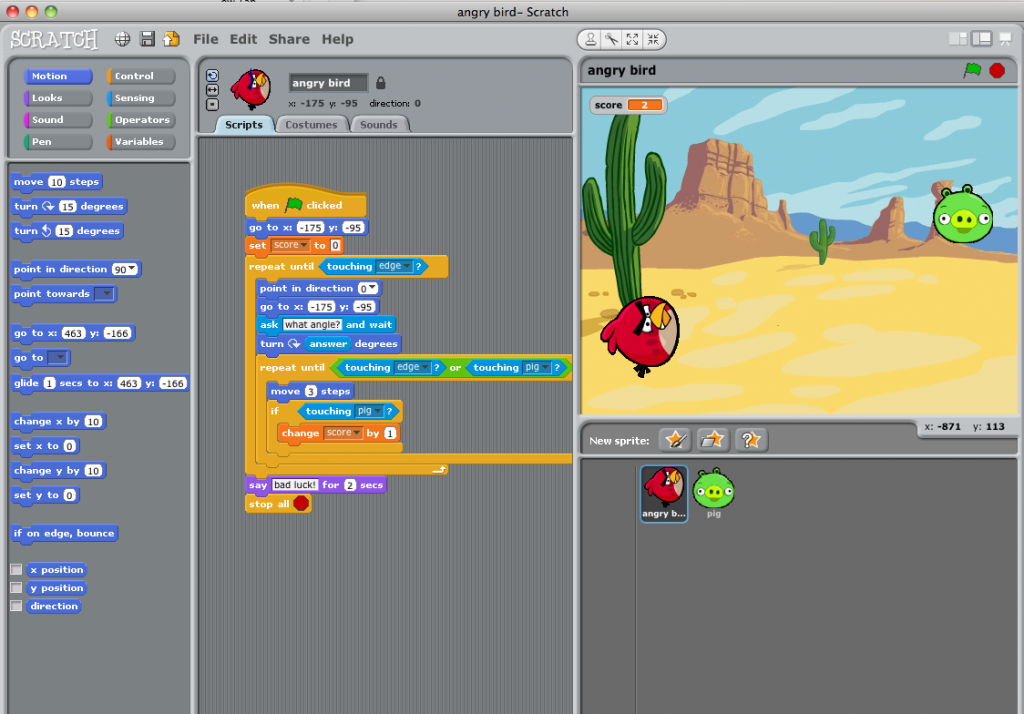
  Angry birds from Simon Haughton: type an angle for the bird to hit the pig.

  Whack-a-witch from Code Club: catch the witches using the mouse

Duck Shoot from Teach ICT: target the birds with the mouse and shoot with the spacebar.

Shark Attack from Teach ICT: Make the shark follow your mouse, eat the fish and avoid the octopus.

You’ll find lots of online resources, lesson plans and ideas on the Scratch Ed website, where you can also share your own projects and download others’ projects to remix. If you share your own project you can get the embed code to put a working copy on your blog. Here’s how to do this

It is useful for children to consolidate their understanding of these introductory programming concepts by revisiting them in a different environment. You might consider Kodu on Xbox or PC, another free visual programming tool in which you create a 3D virtual world and manipulate characters; 2DIY3D in Purple Mash and 2DIY from 2SimpleLittle Big Planet on PS3 and PSP; or free iPad apps such as Cargo Bot and Daisy the Dinosaur.

Have a look at my collection of Primary Computing resources on Pinterest, where you can also download Scratch game instructions and Scratch cards for beginners.

Finally, here’s Matt Lovegrove helping his class of Y4 children create games for Y2 children using 2DIY. Notice how well they take the audience into account in planning and revising their games, and how the activity allows them to apply their maths and science knowledge in a meaningful way:

“Almost all creativity involves purposeful play.”

Abraham Maslow, American psychologist, 1908-1970

(cited by US Play Coalition)   

Session 5: Data, modelling and simulations

This week we are looking at ways of collecting, manipulating and interpreting data. Find some useful links here.

In these days of information overload visual representations offer a useful strategy for helping students see patterns and connections. They also help make information accessible to all learners, including those with EAL or reading challenges.

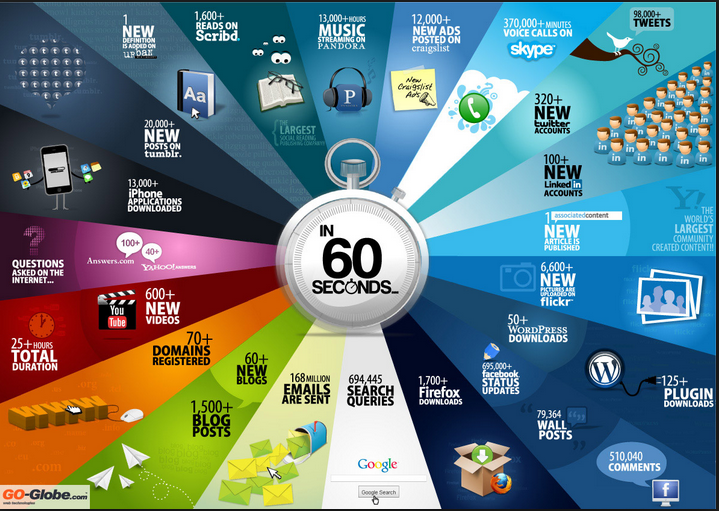
We’ll explore some links and tools for collecting data (raw and unprocessed) and turning it into something that communicates a meaningful message (information). A trend that has been gathering momentum recently is the idea of presenting information through well-designed infographics combining illustrations, text and charts of one kind or another.  Here’s a nice example on photosynthesis from Kids Discover

These infographics often include data visualisations, which show the relationships between data sets using colours and shapes, maybe as a timeline, diagram, flowchart, map, word cloud, graph, concept web or table. Have a look at this TED talk from David McCandless about how these representations can help us to see patterns and connections and ‘make information beautiful’.

You’ll find some lovely examples of these on David’s website, and a Pinterest search of ‘infographics’ reveals many more. Here’s a selection aimed at children from Reading RocketsThe Daily Infographic has a new, data-filled illustration each day  and a good catalogue of past finds. I have my own collection of links for data and infographics on Pinterest too.

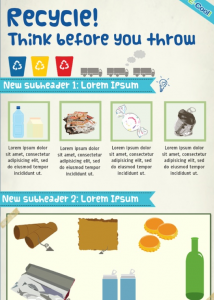
In order for children to get the most out of infographics, they will need to learn how to read and navigate them and how to interpret the charts and diagrams. TechChef4u has 8 lesson ideas for developing infographic interpretation skills. Even better, children can deepen their understanding by making their own infographics.  Online tools such as piktochartvisual.ly and infogr.am, with pre-defined templates offer a simple way to start.

The beauty of these tools is the potential for children to combine their own local investigations with data from around the world and compare trends. This can give them a feel for the difference between first hand data (primary data) and data collected by someone else (secondary data). They come with built-in charts for displaying quantitative data, or you can create your own with tools such as Google Chart EditorPictograph Creator, or Piecolour. You can make your own pictograms in Excel or add word clouds using Wordle or Tagul.  All of these diagrams can then be added to the emerging infographic.

If you’re feeling ambitious you could take the infographics idea a stage further by adding data and information to films using YouTube Annotations Editor or to photostories in Animoto or PhotoPeach. Get inspiration from Little Red Riding Hood reinterpreted as a data story by Tomas Nilsson or this amazing video from General Electric about capturing and converting energy from train brakes.

With infographics creation as a way of sharing findings, children can be encouraged to adopt an inquiry-based approach to data collection and research in collaboration with their peers. It is worth pausing at the beginning of such a project to allow time to come up with a provocative and tantalising question. Watch Ewan McIntosh’s video The Problem Finders and think about how giving students time to define their own problems can help them think more dynamically.

One starting point might be to brainstorm individual topics within an overall theme such as ‘change’.  Taking an historical approach, children might explore census data on the National Archives website and compare it with a database they construct about themselves, including making their own family tree.  From a geographical point of view they could use History Pin and the historical imagery slider in Google Earth to investigate how places have changed over time: (the Beijing and London Olympic Stadiums, the shrinking Aral Sea and the building of the Palm Jumeirah in Dubai are good examples). Climate change offers another slant, with opportunities to scroll around 26,000 weather stations on Wundermaps, or to look at MetlinkGlobalWarmingKids or resources from Education Scotland.  You’ll find some great ideas on TechChef4u for combining webtools, apps and data sources to explore data patterns. Alongside these sources, survey tools such as Google Forms and Survey Monkey can be used to collect local data.

Whether you are reading them or creating them, infographics offer a dramatic way to share data stories. The layering of visuals and text means that they can be interpreted on many levels, making it easier for all learners to make meaning for themselves. See if you can make information beautiful!

Session 4: Classroom Applications

We know you’ve had to work extra hard to get your blogs off the ground in the last couple of weeks but we think this is paying off. They are looking great!

This week many of you will be working in a group to make a classroom resource or set of materials using some of the tools and software you have explored so far. We’d like you to choose one or two tools and make something you could use in the classroom.

This is a chance to tie your thinking to an area of the curriculum and age group, and to show how you could use technology to enhance children’s learning. Start with your learning objectives and then think about how best to achieve them, evaluating whether technology adds anything. Does it:

  • help children achieve something that they couldn’t do any other way?
  • enable access to more content or add depth?
  • offer alternative ways of exploring content through different media?
  • facilitate comments and input from a wider audience or feedback on performance?
  • allow for learning to be more personalised and differentiated
  • give children increased choice and control over the direction of their work?

Or perhaps it is simply more fun and could act as a hook to engage children with a topic.

Alongside the need to give careful thought to planning is the need to evaluate the impact of ICT on learning. Think about how ICT can help children take some responsibility for their own progress and how it can help you to capture evidence of the learning that is going on in your classroom. 

We’d also like you to think about the process of collaborating together. What works? Did you give yourselves roles? How did you support each other? In your reflection this week also try to comment on how you can encourage children to work well together.

Some of you may be ready to move on this week and explore ways of collecting and interrogating data, manipulating variables and representing findings visually through infographics, graphs and charts. You’ll find some resources to browse for Infographics and Data here.

Finally, here’s a blogpost from Susan Brooks-Young to give you all some ideas:


(Drawings by Frits Ahlefeldt on HikingArtist.com’s photostream licensed under a CC 3.0 Unported License.)

Session 3: Digital images and animation: skills and techniques

Well done everyone for getting your blogs up and running! Here’s a link to some ‘how tos’ on blogging. It takes a bit of getting used to at first, but you’ll find blogging is a very useful skill to have as a teacher. Do email me if you’re stuck with anything.

We hope you’re now feeling a little more confident about using the interactive whiteboard. There will be many more opportunities to practise and you can always arrange to pop in and have a go if you’d like to try something out.

We’re looking forward to getting out our lego and playmobile to explore stop frame animation techniques with you this week. We’ll look at MonkeyJam software for this and also explore some online animation tools like GoAnimate.

Here are some links to browse and some super examples from The Downs School. MonkeyJam is free, but there are many alternatives, all of which follow the same principles.

The idea is to keep it simple and fun, and think of animation as another way of exploring and presenting ideas across the curriculum. We’ll revisit animation later on when we look at beginning computing techniques.

Alongside animation we’ll be thinking about ways of using images in the classroom. (More  links here). One of my favourite sites is Google Art Project where you can take virtual tours of world famous art galleries, zoom up close to paintings and curate your own collection.  Other tools worth looking at are Pixton on the desktops and Comic Life on the iPads for making comics. As with animation, you can use the comic format to demonstrate learning around any topic.

We also have some fabulous drawing apps on the iPads. Experiment with these and find out whether our new iPad styluses help you paint like David Hockney!

Hello everyone!

Welcome to Year 1 ICT. We’ll use this blog to tell you about what’s coming up each week and to record highlights as we go.

We’re excited to be using blogs with you to collect thoughts and discoveries, and we look forward to linking to your individual blogs from here so that we can all share ideas easily.

Here are some links to get you thinking about using blogs in schools.  Mr Mitchell and Mr Avery‘s blogs are good examples.  BrainPOP made a fantastic recording of a group of Year 6 children from Heathfield School:

In session 1 we will be looking at the course outline, thinking about recent changes to the ICT curriculum in schools, and setting up your individual blog and twitter accounts. You can read about recent curriculum initiatives on Helen’s blog and explore your free blogging tool on MyPad from the tools block on your Nile homepage. You’ll be able to personalise your blog by choosing from the 137 edublog themes. It would also be useful to set up a twitter account so that we can share our ideas on the School of Education screens and further afield using the hashtag #unsoe.

In session 2 we’ll be exploring interactive whiteboards (IWBs) and presentation software. We’ll have some hands-on with the whiteboard and visualiser and also think about the software and tools you can use to make the most of them. Gareth has been posting about interactive whiteboards. I have posted about presentation software, including eBook-making.  You may like to browse my Pinterest collection for links on maths or literacy. You’ll find a mixture of links for IWB resources and iPad apps. Pinterest is a great site for resource sharing and it’s worth browsing other people’s pins using search terms such as ‘Primary Education’. You’ll find it’s impossible not to get sidetracked by things that catch your eye, but if you join, you can repin anything that looks useful to your own board.

Your directed task this week will be to use your blog and twitter to comment and reflect on the session, making a comparison of tools.

Do let me know if you need any help or have any questions (helen.caldwell@northampton.ac.uk),

Happy blogging!

Helen