


Stevenson et al‘s (2019) report for the Office for Students looks at risks to success in, and progression from, HE. Their recommendations include that institutions “consistently capture good quality data” (p7) but they are conscious of the loss of individuals within top level data and suggest such data may need several years of aggregation to identify more nuanced patterns. They also flag that HEI should contextualise the data they share with students and warn against discussions that risk becoming increasingly abstract.
Reading this report in February 2020 led me to reflect on the themes that had already emerged from this project and the breadth of already available data. The first four months had been very much casting a wide net and actively seeking any indicators that might be generated by and from our student participants, in connection to student engagements. Now, I felt the need to consolidate the emergent student-led themes, and themes apparent in the literature, in one moment through one tool. Our participating students had much less availability in block two, once their placements had started, and time pressures on them had clearly increased as the year had progressed. Having previously reflected with the group about the performative element of ‘student engagement’, I was also conscious that they were very much known to me and seen by me in their previous, qualitative, responses. These considerations combined into the decision to try a new approach and create a primarily quantitative (scale-based) questionnaire that would be completed anonymously. As previously mentioned, the intention was that this would be part one of a two stage process; with part two being a smaller focus group of volunteers from the cohort, to gain student interpretation and explanation of their cohort’s responses. This qualitative balance/participant check did not happen as planned, as a result of COVID-19 measures.
The Continuation, Achievement and Progression (CAP) questionnaire was developed primarily on the basis of the CAP-explanatory factors identified by Stevenson et al (2019). Their references to the 2015 HEFCE report on causes of differences in student outcomes were especially informative.
The CAP questionnaire:
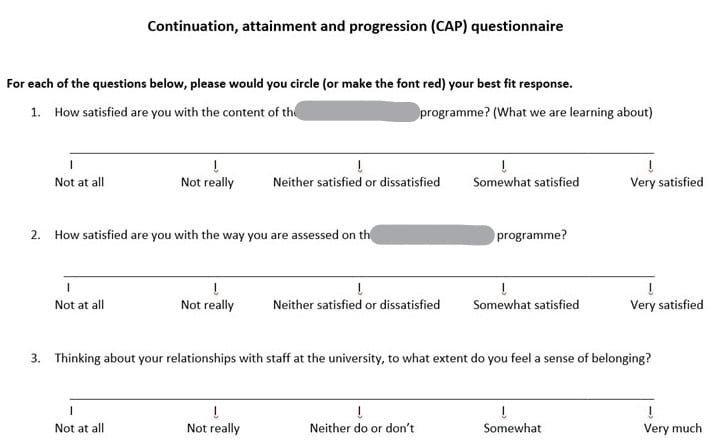

Two thirds of the study cohort participated in this questionnaire (n=20). 45% (n=9) of those participating were ‘BAME’ (Mixed Race, Black British, Black British-African, Black, Black Caribbean). 45% (n=9) were the first generation of their family to go to university.
All ranking responses fell, at an aggregate level, into the positive half of the possible response spread.
The lowest-ranked response (the only one in single digits of an aggregated possible spread of between -40 > 40) was in relation to health and wellbeing.


Satisfaction with course content:
This response indicated the highest satisfaction ranking of all responses. 12/20 respondents gave the maximum satisfaction response. The lowest responses given were neutral (ie. none were negative) and 2 respondents gave this neutral response.
Satisfaction with assessment methods:
This question gained the 3rd highest satisfaction ranking, with all except 1 student giving a positive response. This 1 student did give a maximum satisfaction response to course content and several other questions; in fact, all of their other responses were positive except for Q12 (university readiness) where they were also neutral in response.
Extent of belonging re. relationships with staff:
This question gained the 4th highest satisfaction ranking, with all except 2 students responding positively; Those 2 students’ responses were neutral. 6 students gave the maximum response – they very much felt a sense of belonging in relationships with uni staff.
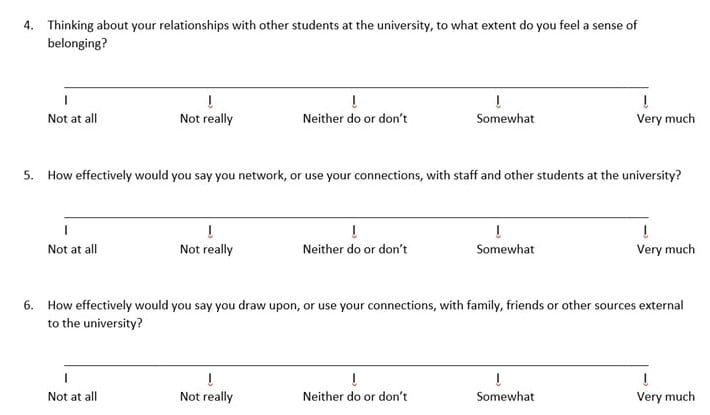
Extent of belonging re. relationships with other students:
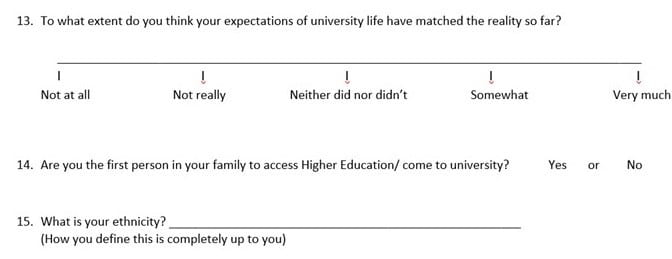
Responses overall indicated that students felt a lower sense of belonging with each other than they did with staff. However, where 6 students had given the maximum response re. staff belonging, 10 gave the maximum response re. student belonging. The overall ranking was brought down by 3 responses in the negative – of those 3 students, all rated their sense of belonging with staff in the positive (with two of those giving the maximum belonging response re. staff belonging). Both of these 2 students are ‘BAME’.
Effectiveness of university network use:
8 students gave the maximum response; for 6 of those 8 this correlated with a maximum response for belonging with either staff or students. However, responses suggest that a strong sense of belonging was not necessary for a student to perceive their university networking as very effective. 1 student rated their effectiveness in networking (both inside and outside of university) at the maximum, and likewise gave the highest possible ranking to their learning engagement – but was neutral re. student belonging and somewhat positive re. staff belonging. 3 students gave negative responses to this question, and 1 was neutral.
Effectiveness of network external to university:
6 students gave the maximum response. These 6 had also ranked their university network use positively (3 of them at the maximum in both instances). This question seems relevant to work-based learning, particularly since students were mid-placement during completion of this questionnaire. Where networks were ranked negatively either inside or out of university, this represented 5 students. No one student responded negatively about both contexts of networking. However, 2 students responded with one negative and one neutral. Their responses bore no correspondence with how they rated their engagement with learning (spanning from the top response to the second lowest re. engagement). ie. there is nothing here that suggests a connection between students’ perception of their networking and their engagement.
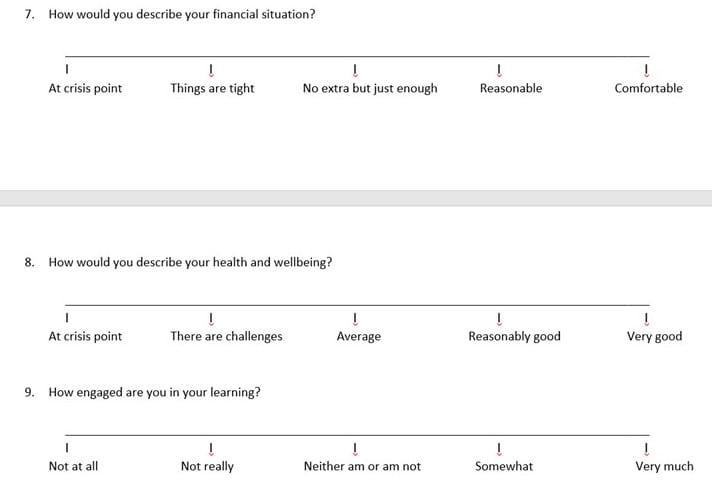
Financial ‘comfort’:
3 students gave the maximum response, that their financial situation was comfortable, with an average response of 0.675 – nearer to ‘reasonable’ than ‘no extra but just enough’. 3 students indicated “things are tight”, although none were at “crisis point”.
Health and Well-being:
This was the most poorly ranked indicator. Although no student indicated that they were at crisis point, 7 students (35%) indicated that their health and well-being presented challenges. Nevertheless, all except 1 of these students indicated that they were positively engaged in their learning (though none gave the maximum response for engagement). 2 students had negatives for both health/well-being and finance. Only 4 students said their health and well-being was very good.
How engaged are students in their learning?
This was the 5th (joint) most positively ranked response, with 5 students giving a maximum ranking. There were no neutral responses to this question with all except one student giving a positive response to their engagement in learning. The 1 student whose engagement rating was negative, indicated they were “not really” engaged. That student later approached me to explain that their engagement was related to their health and well-being – where their response had also been in the negative. I would not have been able to assume a causal relationship between their health and well-being from the questionnaire responses; the student made that link explicit about their own experience.
Of the 5 students who gave the maximum response re. their engagement in learning, all 5 also gave the maximum response re. course content. The other areas of possible correlation are feeling encouraged and supported by programme tutors, and expectations of university being most closely matched by the reality.
To what extent does interaction with programme tutors encourage and support:
This was the second highest ranked response (behind course content). 7 students gave the maximum response and all except 1 response was positive (with that 1 being neutral). NB: One of those who gave the maximum response was the student (above) whose learning engagement was negative.
To what extent does interaction with the uni as a whole encourage and support:
This was the 5th (joint) most positively ranked response, with 7 students giving a maximum ranking (a different 7 students from those who gave programme tutor support the highest ranking). 1 student gave a negative response (their other negative responses being to finance and health/well-being); their only maximum positive response had been to student belonging.
How prepared did students feel they had been for university:
Only 1 student said they felt they had been fully ready and prepared. This was the lowest maximum response to any of the questions. 2 students responded in the negative that they were not prepared (1 “not really” and 1 “not at all”). However, neither of those 2 students indicated that there was a mismatch between their expectations of university and reality so far…. which seems to suggest that even though they felt their expectations were accurate they were still unprepared/not ready. There was no correlation here with whether they were 1st generation to university, nor apparently with any other question.
To what extent did expectations of university match reality:
7 students gave the maximum response. With one exception, amongst these maximum responses there seems to be a correlation with maximum satisfaction with course content. This does not work both ways, in that 1 student who gave the maximum response re. course content responded negatively re. expectations matching reality. 4 students said their expectations of university did not match reality. 2 of those were neutral on course content (which were the lowest two responses received re. course content). More significantly, 3 of those 4 students (who had indicated a mismatch between expectations and reality) also gave a negative response re. health and well-being.
Stevenson et al (2019) warn against reading too much into course level data – especially where numbers are low (as is the case here). Their suggestion is that we should look at the data at the level of individual students: “This also helps to personify students with inequitable outcomes and can serve as a useful counter to increasingly abstract discussions” (op cit, p7). This tallies with their clear message that we should not treat ‘BAME Students’ as one homogeneous group, which (apart from the multiple associated issues including denial and imposition of identity) leads to misdirection of resources and overlooks those who may need particular interventions. I would say this risk is true for the student body as a whole; which is part of the problem of seeing ‘student engagement’ as one objective generic.
Stevenson, J., O’Mahony, J., Khan, O., Ghaffar, F. and Stiell, B. (2019) Understanding and overcoming the challenges of targeting students from under-represented and disadvantaged ethnic backgrounds, Office for Students. Accessed at https://www.officeforstudents.org.uk/media/d21cb263-526d-401c-bc74-299c748e9ecd/ethnicity-targeting-research-report.pdf on 12/02/2020